CAETÊ – Carbon and Ecosystem functional Trait Evaluation
The study of functional traits and functional ecology are fields that are poorly explored by process-based ecosystem modeling. We consider that a functional trait is any measurable aspect of an organism that reflects what it is doing, how it interacts with other organisms and its environment, and which influences its life, reproductive and evolutionary performance. As such, functional diversity separates biological entities either in a discrete or continuum fashion, whereas taxonomic diversity does that separation exclusively in a discrete way. A handful of studies (e.g. Díaz et al. 2016 Nature) show that the (co-)variation of key plant traits – such as stem wood density and seed mass – is determinant for the morphology, ecophysiology and the niches that are occupied in a given ecosystem.
Dynamic Global Vegetation Models (DGVMs) have historically employed a very reduced number of plant functional types (PFTs) to represent the enormous diversity – functional and taxonomic – present in the tropics. That is because the functional traits that describe each PFT are constant in time and space in these standard DGMVs. In that context, the CAETÊ model holds the premise that some functional traits can have varying values inside the model, and that the number of PFTs, called as plant life strategies (PLS) in the CAETÊ model, can be considerably more numerous compared to conventional DGVMs. Functional traits in which the model is focused now are: specific leaf area, stem wood density, plant height, leaf nitrogen and phosphorus content and sensitivity of stomatal conductance (g1). It is also intended that “trade-offs” are associated to each varying trait, to avoid the occurrence of “super-plants” that do not exist in observational data.
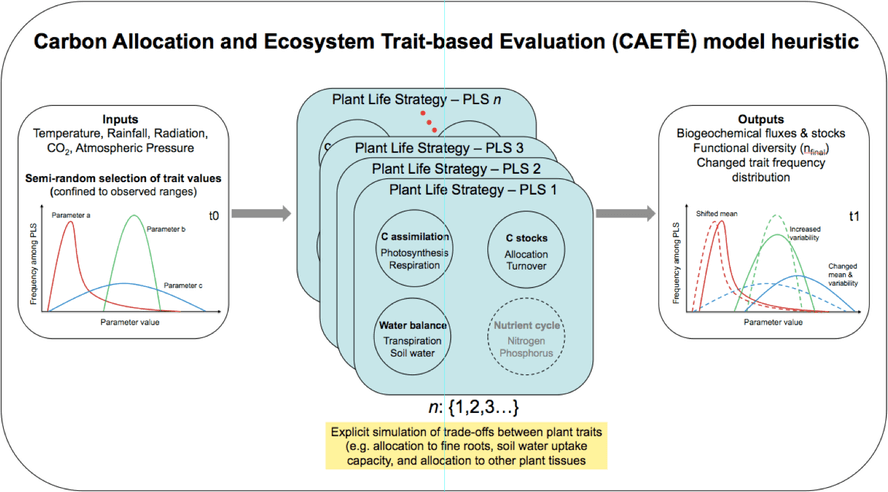
CAETÊ user determines, at the start of each model simulation, the N number of PLS to be simulated; after that the model makes a semi-randomized selection of values for the varying functional traits and constructs N different numerical combinations with the selected values. This selection is semi-randomized because the upper and lower boundary values of each trait are provided as input to the model based on observational data, and also by the fact that, should the availability of data allow, a frequency distribution curve determines the probability of selection of a given value. As a next step, the model calculates the fluxes and stocks of carbon, water, nitrogen and phosphorus for each grid cell, for each of the N PLS being simulated. PLS exclusion mechanisms, either by climatic filtering or inter-PLS competition, is what drives the variation in the occurrence of a given PLS in time and space. However, CAETÊ is not restricted to the simulation of PLS occurrence, but also the geographic and temporal distribution value frequency of the varying functional traits, for example through community weighted mean metrics.
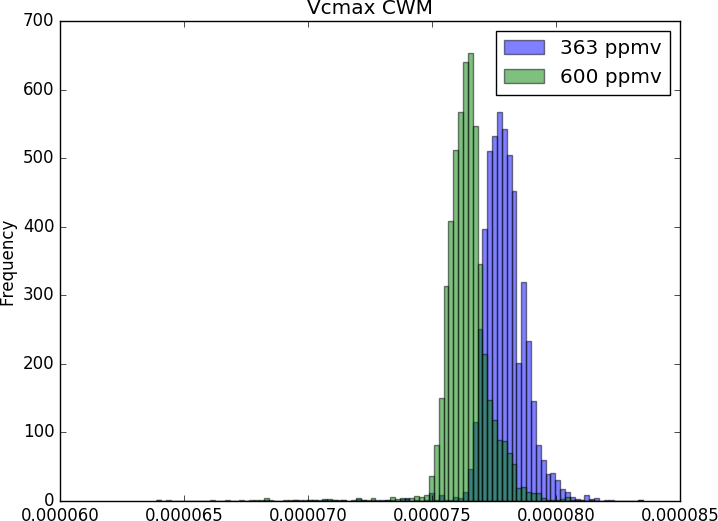
As such, beyond the exploration of biogeochemistry-related scientific question (e.g. fluxes and stocks of carbono and water), the CAETÊ model allows for the investigation of questions related to an ecosystem’s functional diversity (e.g. how functional diversity is impacted by an increase in atmospheric CO2?), in its different dimensions: richness, redundancy and divergence. That puts CAETÊ close to the theory and practice in community ecology. Moreover, the representation of plant types in less discretized and more continuum fashion permits the simulation of more subtle changes in the vegetation in response to environmental changes.
CAETÊ is a dynamic model (like other DGVMs) and runs at global scale (one degree spatial resolution) but can have its model runs restricted to regions or even specific locations of the planet.
Questions, collaboration, or source-code? Write us at labterra@unicamp.br
* CAETÊ is a word from the brazilian indigenous Tupi-language that means “real forest, forest with big trees, virgin forest”.